Page 22 - 2023 Special Report on the State of Business in South China
P. 22
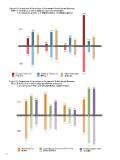
Figure 11 Comparison of Percentage of Companies?? Global Annual Revenue
?ľčˇ¨ 11 from China in 2021 & 2022 (by Origins of Companies)
2021&2022ĺą´ĺ?????Ąĺ??¨ç??Ąć?ćŻ??对ć?ďĽ???§ĺ?家ć?ćş?????
Figure 12 Comparison of Percentage of Companies?? Global Annual Revenue
?ľčˇ¨ 12 from China in 2021 & 2022 (by Different Industries)
2021&2022ĺą´ĺ?????Ąĺ??¨ç??Ąć?ćŻ??对ć?ďĽ???§č?ä¸?????
22