Page 40 - 2021 Special Report
P. 40
T o accommodate the fluctuating sample фИКф???????фМ???Ащ????хЏЙш??Ѕч????
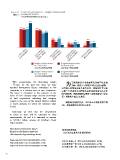
sizes, for the past few years we have хНБх?яМ??фЛ??хЙДщ??ЈфЛЅ100хЎЖф?фИ?ИК?Кц?яМ?
reported reinvestment figures normalized to 100 хЏЙх?шП???????????щЂ??хЏЙц?яМ?????шЎЁч??Йц?
companies as a primary year on year comparison. ???фИ?фИ?БЛ???фИ???Мф?фЛЅш?чБЛх??Јц????шЎПф?фИ?
The figure is calculated as the products of the ?????цЏ??яМ????шЕ?????щЋ?ЁЙяМ?ОО?Ац?шЖ??2.5фКПч?
mean of each category range and the percentage ????????хА???2.5фКПч?????
of total respondents indicating that category, ?Йц???ЛЌ????Ѕч????2021хЙДх???????хА????
except in the case of the largest (US$250 million 3%яМ??шЕ??щЂ??шООх?183фКПч?????
or more) category, for which the minimum value
is used. ??????шЕ????
яМ?ЛЅ100хЎЖф?фИ?????фО?ИК???яМ?
Noticeably we find that the reinvestment
in China in 2021 will be expected to drop 2021хЙДц??Ѕф?хЙ?: US$ 3,065,000,000 (-3.1%)
approximately 3% and it is estimated to amount 2020хЙДц??Ѕф?хЙ?: US$ 3,163,800,000 (-2.7%)
to US$18.3 billion among all AmCham South 2019хЙДц??Ѕф?хЙДя?US$ 4,362,500,000 (+37.9%)
China members.
Normalized reinvestment figures
(Response distribution applied to
100 companies by percentage share)
Projected 2021: US$ 3,065,000,000 (-3.1%)
Projected 2020: US$ 3,163,800,000 (-2.7%)
Projected 2019: US$ 4,362,500,000 (+37.9%)
40