Page 7 - 2020 Mid-Year Special Report
P. 7
ographics
???�?�?
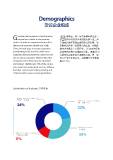
Generally, demographics of participating ?»ä????ďĽ??ä¸??年度č°?????ä¸??
companies is similar to our previous ĺľ?ĺą´ç????äĽ??ç»??大ä?ä¸??´ă??¸ş
studies. In order to comprehensively reflect äş???˘ĺ????????şĺ????ç»??形ĺ?ďĽ??
the present economic situation in South ä»???şé??????ć¤éˇą??©¶???ä¸??并确äż?
China, we took steps to ensure companies ?·ć?äĽ??涵ç?äş?????ä¸??? čż?34ďĽ?????
participating in this research, which were äĽ???Ąč?ć¶?´ąäş§ĺ?????ˇč?ä¸??? ?Ąč?čż?33
randomly selected, represent a true cross sec- ďĽ?????äĽ???Ąč?ä¸?????čˇ?????ä¸???
tion of various industries. Nearly 34% of the ç¬??产ä?äĽ????22ďĽ???¶ä????äĽ?????
companies come from consumer products ???11�??
and services. Slightly over 33% of the compa-
nies come from professional services. 22% are
from first- and second-tertiary industry, and
11% from other services and organizations.
Distribution of Industry �????
???�?�?
Generally, demographics of participating ?»ä????ďĽ??ä¸??年度č°?????ä¸??
companies is similar to our previous ĺľ?ĺą´ç????äĽ??ç»??大ä?ä¸??´ă??¸ş
studies. In order to comprehensively reflect äş???˘ĺ????????şĺ????ç»??形ĺ?ďĽ??
the present economic situation in South ä»???şé??????ć¤éˇą??©¶???ä¸??并确äż?
China, we took steps to ensure companies ?·ć?äĽ??涵ç?äş?????ä¸??? čż?34ďĽ?????
participating in this research, which were äĽ???Ąč?ć¶?´ąäş§ĺ?????ˇč?ä¸??? ?Ąč?čż?33
randomly selected, represent a true cross sec- ďĽ?????äĽ???Ąč?ä¸?????čˇ?????ä¸???
tion of various industries. Nearly 34% of the ç¬??产ä?äĽ????22ďĽ???¶ä????äĽ?????
companies come from consumer products ???11�??
and services. Slightly over 33% of the compa-
nies come from professional services. 22% are
from first- and second-tertiary industry, and
11% from other services and organizations.
Distribution of Industry �????