Page 25 - 2017 Special Report
P. 25
5 10 10% 4% 8% 7%
4% 7%
8%
5 4% 4%
2016 Budgeted vs. Actual Reinvestment in China
0 0 ĺŻ?o investmBLeeensttswteheannUUSS$$11mmBieillltliiowonneeanndUUS$S1$010mNBmeoiltliiiwlonlienoveenansntmUdBLSeUee$nsSt5tsw$0t5ehm0eanminllUiiUolSlnSio$$a1n1nmmdBieUillltliSiowo$nne2ea5nn0MdUmoUSir$lSel1i$ot01hn0amBnmeilUtliiwlolSieno$en2an5n0UdmSU$iSl52l$i0o5ćŻ??0nm0?»é?1mill6??ą´iiollnĺą??Ąč?oan???n??ďĽ?¸U???2S0$ä»??2156č§?0ĺą´ç?MmĺŻ?é˘??ir??elç®?ot???hn??č®?čµ????ä¸??¨é?$ć?2??5ć¬?0čż??smčˇ?.??lč¶?ĺ®?č°?čż??Ąé?2??.5???äşżć???????čµ????????
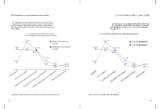
Comparing reinvestment budgets for 2016 against realized reinvestment čµ??äĽ??ćŻ??ĺ®??ä¸??8%???äş?ş¦4%???ä˝???şé???????čµ??ĺş?
volumes in the same period, we find that the share of companies with more
than US$250 million in realized reinvestment has decreased to around 4% from ???�?�?�???
approximately 8%. Meanwhile, the breakdown of other acutual reinvestment quota
has risen slightly.
Comparison of the Share of Companies?? 2016ĺą´ĺ????ç®?????é˘??ĺ®?????čµ?????ä¸??äľ??ćŻ?*
2016 Budgeted & Actual Reinvestment in China* 40
37.5% 40 37.5% 40
27% 3527.5% Acutal reinvest3m5ent Acutal reinves3tm5ent
3206% 28% in 2016
25 30
27% 27.5% Budgeted reinv2e5stment in 2016 30
26% in 2016
Budgeted rein2v5estment
20 in 2016
20 13% 15 20
15 7% 7% 13% 10 15
10 10% 4% 8% 5 8%
4% 7% 7% 10
5 4% 4% 5
0 0mBieillltliiowonneeanndUUS$S1$010mBmeiNltliiowlolieinonenavnensUdtSmU$BLSe5ee$n0st5tswm0tehmielalniinollUniUoSaSn$n$11dmmUBiSeilll$tliiow2on5ne0eaMnnmodUirleUSli$oSth1n$a01n0mBUmeilStliiwl$oli2eno5ena0nnmUdSiUll$iSo5$n05m0 milliiollnioannd US$250Mmoirleliothnan US$250 million
0
* The proportion in the figure indicates the share of companies with their budgeted and actual reinvestment quota. * ?ľä¸??????为ä?ä¸??ä¸???şé????ç®?????????????????äľ???
48 40 49
35
4% 7%
8%
5 4% 4%
2016 Budgeted vs. Actual Reinvestment in China
0 0 ĺŻ?o investmBLeeensttswteheannUUSS$$11mmBieillltliiowonneeanndUUS$S1$010mNBmeoiltliiiwlonlienoveenansntmUdBLSeUee$nsSt5tsw$0t5ehm0eanminllUiiUolSlnSio$$a1n1nmmdBieUillltliSiowo$nne2ea5nn0MdUmoUSir$lSel1i$ot01hn0amBnmeilUtliiwlolSieno$en2an5n0UdmSU$iSl52l$i0o5ćŻ??0nm0?»é?1mill6??ą´iiollnĺą??Ąč?oan???n??ďĽ?¸U???2S0$ä»??2156č§?0ĺą´ç?MmĺŻ?é˘??ir??elç®?ot???hn??č®?čµ????ä¸??¨é?$ć?2??5ć¬?0čż??smčˇ?.??lč¶?ĺ®?č°?čż??Ąé?2??.5???äşżć???????čµ????????
Comparing reinvestment budgets for 2016 against realized reinvestment čµ??äĽ??ćŻ??ĺ®??ä¸??8%???äş?ş¦4%???ä˝???şé???????čµ??ĺş?
volumes in the same period, we find that the share of companies with more
than US$250 million in realized reinvestment has decreased to around 4% from ???�?�?�???
approximately 8%. Meanwhile, the breakdown of other acutual reinvestment quota
has risen slightly.
Comparison of the Share of Companies?? 2016ĺą´ĺ????ç®?????é˘??ĺ®?????čµ?????ä¸??äľ??ćŻ?*
2016 Budgeted & Actual Reinvestment in China* 40
37.5% 40 37.5% 40
27% 3527.5% Acutal reinvest3m5ent Acutal reinves3tm5ent
3206% 28% in 2016
25 30
27% 27.5% Budgeted reinv2e5stment in 2016 30
26% in 2016
Budgeted rein2v5estment
20 in 2016
20 13% 15 20
15 7% 7% 13% 10 15
10 10% 4% 8% 5 8%
4% 7% 7% 10
5 4% 4% 5
0 0mBieillltliiowonneeanndUUS$S1$010mBmeiNltliiowlolieinonenavnensUdtSmU$BLSe5ee$n0st5tswm0tehmielalniinollUniUoSaSn$n$11dmmUBiSeilll$tliiow2on5ne0eaMnnmodUirleUSli$oSth1n$a01n0mBUmeilStliiwl$oli2eno5ena0nnmUdSiUll$iSo5$n05m0 milliiollnioannd US$250Mmoirleliothnan US$250 million
0
* The proportion in the figure indicates the share of companies with their budgeted and actual reinvestment quota. * ?ľä¸??????为ä?ä¸??ä¸???şé????ç®?????????????????äľ???
48 40 49
35