Page 19 - 2017 Special Report
P. 19
Primary & 14.5% 15.5% 18.5% 11.5% 34% 6%
Secondary
Sector
Consumption 25% 15% 30% 5% 12.5% 12.5% Between US$5
Products & More than US$
Services Not applicable
Less than US$1
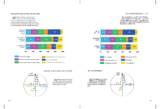
Annual Revenue in China in 2016 (III) Primary & 14.5% 15.5% 18.5% 11.5% 34% 6% Professional 12.5% 21% 2016ĺą´ĺ???ą´ĺş??»ć??Ąď?IIIďĽ? Between US$1
Secondary Services Between US$1
While the respondents of primary and ä»?24% 12.5%čˇ??11ç»?.5%?????1ďĽ?8.5ä»?%äş??ä¸????äş?ş§ä¸????
secondary sectors realized the highest Sector 访ä?ä¸?2016ĺą´ĺ?????Ąć?é«???¶ä¸çş????
revenues in China with more than 30% of those
being over US$250 million, the breakdown of those Consumption 25% 15% Prim3a0ry%& 5% 12.5% 12.5% 0% Betw2e0e%n US$50 mil4li0o%n and US$???25访ć?600?ˇä?m%i???llioĺą´ĺ?n ĺş??äĽ???Ąä?80č¶?»Ą%čż????2.5ä»?şżä¸??1ä¸?0??0??%ďĽ??ä»??äş??ć¶??č´ąä????产ĺ????
respondents in the consumption products and services Products & Secondary 14.5% 15.5% 18.5%
as well as professional services is distributed evenly. Services 11.5% 34M%ore than U6S%$250 million ??ą´ĺş???Ąć°´ĺąłĺ?čľ?¸şĺąłĺ???
Sector Not applicable (eg. representation o ce)
Primary & Professional 12.5% 21% 24% 12.5% 11.5% 18.5%
Secondary Services 20% Consumption
25% 15% Less than US$1 million Between US$50 million and US$250 million
Sector Products & 80% 100% 30% 5% 12.5% 12.5%
14.5% 15.5% 18.5% 11.5% 34% 6% 40% Servic6e0s%
Between US$1 million and US$10 million More than US$250 million
0%
ProfSeessrivoicnBeaesltw1e2e.5n%US$502m1%illion and U2S4$%250 mil1li2o.5n% Between US$10 million an5d5U%S$50 millionNot applicable (eg. representation o ce)
Consumption 11.5% 18.5% Increase 50%
Products & 25% 15% 30% 5% 12.5% 12.5%
Services 40%Less than US$1 million
Mo0r%e than US$220%50 million40% 60% 80% 100%
6% 30%Between US$1 million and US$10 million
5% 12.5%
PrBoefSetwessreiveoincneUaslS$5102m.5il%lion and 21% million 24% 12.5% 11.5% 18.5% Not applicable (eg. representation o ce) 11% 20%
18.5% 60% 80% 100% Less than US$1 million Not 10%Between US$10 million and US$50 million
% 100% US$250 applicable
25%
Comparable
9%
More than U0S%$250 million20% 40% Between US$1 million and US$10 million Decrease
Not applicable (eg. representation o ce) Between US$10 million and US$50 million
Less than US$1 million
Between US$1 million and US$10 million
Between US$10 million and US$50 million
Changes in Annual Revenue in China ?¨ĺ?年度?Ąć????
55% č¶????????访ä?ä¸?ˇ¨ç¤şä?
Increase 50% ä»??2016ĺą´ç??Ąć?对ć?
2015ĺą´ć???ĺ˘??ďĽ??????°ĺ?č®?
40% Referring to changes of revenue äĽ??表示ä»?»¬2016ĺą´ç??Ąć????
from 2015 to 2016, more than ?????
30% half of respondents reported a rise in
annual revenues this year.
20%
11% 10% 25%
Not Comparable
applicable
9%
Decrease
36 37
Secondary
Sector
Consumption 25% 15% 30% 5% 12.5% 12.5% Between US$5
Products & More than US$
Services Not applicable
Less than US$1
Annual Revenue in China in 2016 (III) Primary & 14.5% 15.5% 18.5% 11.5% 34% 6% Professional 12.5% 21% 2016ĺą´ĺ???ą´ĺş??»ć??Ąď?IIIďĽ? Between US$1
Secondary Services Between US$1
While the respondents of primary and ä»?24% 12.5%čˇ??11ç»?.5%?????1ďĽ?8.5ä»?%äş??ä¸????äş?ş§ä¸????
secondary sectors realized the highest Sector 访ä?ä¸?2016ĺą´ĺ?????Ąć?é«???¶ä¸çş????
revenues in China with more than 30% of those
being over US$250 million, the breakdown of those Consumption 25% 15% Prim3a0ry%& 5% 12.5% 12.5% 0% Betw2e0e%n US$50 mil4li0o%n and US$???25访ć?600?ˇä?m%i???llioĺą´ĺ?n ĺş??äĽ???Ąä?80č¶?»Ą%čż????2.5ä»?şżä¸??1ä¸?0??0??%ďĽ??ä»??äş??ć¶??č´ąä????产ĺ????
respondents in the consumption products and services Products & Secondary 14.5% 15.5% 18.5%
as well as professional services is distributed evenly. Services 11.5% 34M%ore than U6S%$250 million ??ą´ĺş???Ąć°´ĺąłĺ?čľ?¸şĺąłĺ???
Sector Not applicable (eg. representation o ce)
Primary & Professional 12.5% 21% 24% 12.5% 11.5% 18.5%
Secondary Services 20% Consumption
25% 15% Less than US$1 million Between US$50 million and US$250 million
Sector Products & 80% 100% 30% 5% 12.5% 12.5%
14.5% 15.5% 18.5% 11.5% 34% 6% 40% Servic6e0s%
Between US$1 million and US$10 million More than US$250 million
0%
ProfSeessrivoicnBeaesltw1e2e.5n%US$502m1%illion and U2S4$%250 mil1li2o.5n% Between US$10 million an5d5U%S$50 millionNot applicable (eg. representation o ce)
Consumption 11.5% 18.5% Increase 50%
Products & 25% 15% 30% 5% 12.5% 12.5%
Services 40%Less than US$1 million
Mo0r%e than US$220%50 million40% 60% 80% 100%
6% 30%Between US$1 million and US$10 million
5% 12.5%
PrBoefSetwessreiveoincneUaslS$5102m.5il%lion and 21% million 24% 12.5% 11.5% 18.5% Not applicable (eg. representation o ce) 11% 20%
18.5% 60% 80% 100% Less than US$1 million Not 10%Between US$10 million and US$50 million
% 100% US$250 applicable
25%
Comparable
9%
More than U0S%$250 million20% 40% Between US$1 million and US$10 million Decrease
Not applicable (eg. representation o ce) Between US$10 million and US$50 million
Less than US$1 million
Between US$1 million and US$10 million
Between US$10 million and US$50 million
Changes in Annual Revenue in China ?¨ĺ?年度?Ąć????
55% č¶????????访ä?ä¸?ˇ¨ç¤şä?
Increase 50% ä»??2016ĺą´ç??Ąć?对ć?
2015ĺą´ć???ĺ˘??ďĽ??????°ĺ?č®?
40% Referring to changes of revenue äĽ??表示ä»?»¬2016ĺą´ç??Ąć????
from 2015 to 2016, more than ?????
30% half of respondents reported a rise in
annual revenues this year.
20%
11% 10% 25%
Not Comparable
applicable
9%
Decrease
36 37