Page 16 - 2017 Special Report
P. 16
80 18% More than US$250 million
10302%
60 23% Betw29e%en US$50 million and US$250 million
Between US$10 million and US$50 million
80 46% 17% 20%
Betw13e%en US$1 million and US$10 million
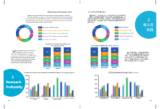
40 Global Annual Revenue in 2016 2016ĺą´ĺ???ą´ĺş??»ć???
20 60
0 There was a general decline of annual revenue among participating companies, ??100?¨ć?ĺş???łć?ĺą´ĺ???496%?¶č???%é«?????ä˝?42ç»????????00012ćµ??č¨???%PďĽ??r?°ď?im??????aryĺ¤??访ĺ?211&S9230eäş??222S???%c%%%e030tcç¬??o2%%%č¶??or1sn段ä?d?żĺ?%ar???čż??y ?˝ç?ĺ°¤ĺ?äş??ä¸???o产ĺ?ĺą´ć?nsä¸??u???m&221ďĽ??212p?¶ĺ?S034t393ie???o%%%%%%???rnvi访ä?Pc??ą´erosä¸???¶ä?duä¸??cä¸??ts???ä»˝ĺ?大ĺ?Pé˘?¤§rLo?¨ç???¸efess??????ss122iot访ĺ?134?şĺ?nha%%%???la??ą´Sneĺą´ä?čż??rvUicSes$1 million 2.
either worldwide or in China, in 2016, which implies that the recovery of the global ?¶ĺ?ä¸?
32% economy is still on the way. While respondents in professional services earned relatively 80
60 ?©ć¶¦
12% high worldwide annual revenues, participating companies in the primary and secondary
sectors generated large annual turno3v2%ers in Ch1i8n%a. More than US$250 million
Between US$50 million and US$250 million
17% Between US$10 million and US$50 million
18% Mor1e2%than US$250 millionBetween US$1 million and US$10 million
21% Less than US$1 million
Between US$50 million and US$250 million 40 14%
23%
17% Between US$10 million and US$50 million 20 10% 21%
12% 14%
Between US$1 million and US$10 million 100 23%
21% Less than US$1 million 0 Primary & Secondary Consumption Products Professional Services
Sectors 80 & Services
Breakdown of Global Annual Revenue 60
by Industries (2016)
ä¸??čˇ???????ą´ĺş??»ć??Ąć??µď?2016ďĽ?
100 100 40
While the global revenues of AmCham?? 80 46% 23% 29% 100
wholly foreign-owned companies 80
still remain relatively high, the local Chinese 60 20% 13% 20 23% ä»? 29%äĽ??ç±»ĺ??Ąç?ďĽ???????????čµ?
companies are usually of less than US$50 million 60 20% �?�????�?�?�??????
revenue 2016. On the other hand, more than 9% 20% 23% 460 % ĺą´ć??Ąď?ä˝?¸čµ??ä¸???¨ç?ĺą´ć??Ąĺ???¸??
40% of respondents in primary and secondary 40 23% 80 5000ä¸????»Ąä¸????čˇ????±»?Ąç?ďĽ??ä¸?
sectors generated relatively high global 20 10% 14% 21% ???äş?ş§ä¸??ä˝?ą´?¶ĺ?čľ??ďĽ??čż???????
revenues of over US$250 million in 2016. 40
12% 13%访ä?ä¸????ą´?¶ĺ?č¶??2.5äşżĺ?çľ????
23% 14% 20
0 Primary & Secondary
Sectors 60
Consumption Products Professional Services 0 9% 20% 23%
& Services
Breakdown of Global Annual Revenue by Different Types of Companies (2016) 40 23% 14% 21%ä¸??äĽ??ç±»ĺ??????ą´ĺş??»ć??Ąć??µď?2016ďĽ?
2.100 50% 2429% % 20 10%
12%
23% 100 33%
Rev80enue &46% 40% 23%
80 25% 13% 14%
30% 20%29% 30% 31% 0 Primary & Secondary
25% 24% Sectors
Pro6f0itability 20% 60
24% 24% 23% 20% Consumption Products Professional Services
21% & Services
40
15% 20%11% 20 23% 14%
6%
9% 10%
40 3% 0
3020 23% 14%0% Joint venture Representative o ce of Local Chinese company
Wholly foreign-owned company
10% company 21%foreign company
12% 31
23%
100
14%
10302%
60 23% Betw29e%en US$50 million and US$250 million
Between US$10 million and US$50 million
80 46% 17% 20%
Betw13e%en US$1 million and US$10 million
40 Global Annual Revenue in 2016 2016ĺą´ĺ???ą´ĺş??»ć???
20 60
0 There was a general decline of annual revenue among participating companies, ??100?¨ć?ĺş???łć?ĺą´ĺ???496%?¶č???%é«?????ä˝?42ç»????????00012ćµ??č¨???%PďĽ??r?°ď?im??????aryĺ¤??访ĺ?211&S9230eäş??222S???%c%%%e030tcç¬??o2%%%č¶??or1sn段ä?d?żĺ?%ar???čż??y ?˝ç?ĺ°¤ĺ?äş??ä¸???o产ĺ?ĺą´ć?nsä¸??u???m&221ďĽ??212p?¶ĺ?S034t393ie???o%%%%%%???rnvi访ä?Pc??ą´erosä¸???¶ä?duä¸??cä¸??ts???ä»˝ĺ?大ĺ?Pé˘?¤§rLo?¨ç???¸efess??????ss122iot访ĺ?134?şĺ?nha%%%???la??ą´Sneĺą´ä?čż??rvUicSes$1 million 2.
either worldwide or in China, in 2016, which implies that the recovery of the global ?¶ĺ?ä¸?
32% economy is still on the way. While respondents in professional services earned relatively 80
60 ?©ć¶¦
12% high worldwide annual revenues, participating companies in the primary and secondary
sectors generated large annual turno3v2%ers in Ch1i8n%a. More than US$250 million
Between US$50 million and US$250 million
17% Between US$10 million and US$50 million
18% Mor1e2%than US$250 millionBetween US$1 million and US$10 million
21% Less than US$1 million
Between US$50 million and US$250 million 40 14%
23%
17% Between US$10 million and US$50 million 20 10% 21%
12% 14%
Between US$1 million and US$10 million 100 23%
21% Less than US$1 million 0 Primary & Secondary Consumption Products Professional Services
Sectors 80 & Services
Breakdown of Global Annual Revenue 60
by Industries (2016)
ä¸??čˇ???????ą´ĺş??»ć??Ąć??µď?2016ďĽ?
100 100 40
While the global revenues of AmCham?? 80 46% 23% 29% 100
wholly foreign-owned companies 80
still remain relatively high, the local Chinese 60 20% 13% 20 23% ä»? 29%äĽ??ç±»ĺ??Ąç?ďĽ???????????čµ?
companies are usually of less than US$50 million 60 20% �?�????�?�?�??????
revenue 2016. On the other hand, more than 9% 20% 23% 460 % ĺą´ć??Ąď?ä˝?¸čµ??ä¸???¨ç?ĺą´ć??Ąĺ???¸??
40% of respondents in primary and secondary 40 23% 80 5000ä¸????»Ąä¸????čˇ????±»?Ąç?ďĽ??ä¸?
sectors generated relatively high global 20 10% 14% 21% ???äş?ş§ä¸??ä˝?ą´?¶ĺ?čľ??ďĽ??čż???????
revenues of over US$250 million in 2016. 40
12% 13%访ä?ä¸????ą´?¶ĺ?č¶??2.5äşżĺ?çľ????
23% 14% 20
0 Primary & Secondary
Sectors 60
Consumption Products Professional Services 0 9% 20% 23%
& Services
Breakdown of Global Annual Revenue by Different Types of Companies (2016) 40 23% 14% 21%ä¸??äĽ??ç±»ĺ??????ą´ĺş??»ć??Ąć??µď?2016ďĽ?
2.100 50% 2429% % 20 10%
12%
23% 100 33%
Rev80enue &46% 40% 23%
80 25% 13% 14%
30% 20%29% 30% 31% 0 Primary & Secondary
25% 24% Sectors
Pro6f0itability 20% 60
24% 24% 23% 20% Consumption Products Professional Services
21% & Services
40
15% 20%11% 20 23% 14%
6%
9% 10%
40 3% 0
3020 23% 14%0% Joint venture Representative o ce of Local Chinese company
Wholly foreign-owned company
10% company 21%foreign company
12% 31
23%
100
14%