Page 278 - 2015_WhitePaper_web
P. 278
5 White Paper on the Business Environment in China
4.2 Revenue and Profitability
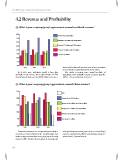
Q: What is your company/group?? approximate annual worldwide revenue?
40%
Greater than $500 million
35%
Between $101 million and $500 million
30%
25% Between $11 million and $100 million
20% Between $1 million and $10 million
15% Less than $1 million
10%
5%
0% 2014 2013 feature which tracks with common sense as larger companies
2015 are more likely to expand beyond their home market.
As in prior years, participants tended to have large Also similar to previous years, around two-thirds of
worldwide annual revenues. We see approximately one third participants report worldwide revenues of greater than $11
of participants having more than $500 million in revenue, a million??his year 68 percent of the total.
Q: What is your company/group?? approximate annual China revenue?
25%
N/A
20% Greater than $250 million
Between $50 million and $250 million
15%
Between $11 million and $50 million
10%
Between $1 million and $10 million
5% Less than $1 million
0% 2014 2013
2015
is year?? participants were comparatively more likely to of study participants reporting zero revenue as a result of legal
see revenue in China of between $11 and $50 million over status (i.e. representation o ces), with that gure rising to 9
smaller or larger amounts than in any prior year of the study percent from 5.5 percent last year.
except for 2006. is year also saw growth in the proportion
278
4.2 Revenue and Profitability
Q: What is your company/group?? approximate annual worldwide revenue?
40%
Greater than $500 million
35%
Between $101 million and $500 million
30%
25% Between $11 million and $100 million
20% Between $1 million and $10 million
15% Less than $1 million
10%
5%
0% 2014 2013 feature which tracks with common sense as larger companies
2015 are more likely to expand beyond their home market.
As in prior years, participants tended to have large Also similar to previous years, around two-thirds of
worldwide annual revenues. We see approximately one third participants report worldwide revenues of greater than $11
of participants having more than $500 million in revenue, a million??his year 68 percent of the total.
Q: What is your company/group?? approximate annual China revenue?
25%
N/A
20% Greater than $250 million
Between $50 million and $250 million
15%
Between $11 million and $50 million
10%
Between $1 million and $10 million
5% Less than $1 million
0% 2014 2013
2015
is year?? participants were comparatively more likely to of study participants reporting zero revenue as a result of legal
see revenue in China of between $11 and $50 million over status (i.e. representation o ces), with that gure rising to 9
smaller or larger amounts than in any prior year of the study percent from 5.5 percent last year.
except for 2006. is year also saw growth in the proportion
278