Page 286 - 2015_WhitePaper_web
P. 286
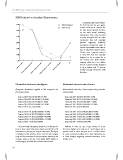
5 White Paper on the Business Environment in China Comparing reinvestment budgets
for 2014 reported last year against
2014 Budgeted vs. Actualized Reinvestment realized reinvestment volumes for
the same period reported this year,
35% 2014 Budgeted we can make several interesting
2014 Actual observations. First, only one-third
as many companies did not make
30% investments than had originally
25% planned, suggesting (relatively)
20% spontaneous investments made to
15% capture opportunities rather than as
10% part of organized expansion plans.
Second, more companies invested
5% at every level than had originally
budgeted to do so except for in
million Greater than $250 million N/A the ??reater than $250 million??
million category, which saw a net decline
million from 8.4 percent having budgeted
million to do so against only 5.9 percent
actually securing investments with
Less than $1 that value.
Between $1 million and $10
BeBtetweweeenn$5$010milmliillioonnaanndd$2$5500
Normalized reinvestment figures Estimated reinvestment volumes
(Response distribution applied to 100 companies by (Normalized, scaled by a factor representing chamber
percentage share) membership)
Projected 2015: $3,030,100,000 (-9.3%) Estimated 2015: $12,029,504,000 (-9.3%)
Projected 2014: $3,343,500,000 (+30.10%) Estimated 2014: $13,273,703,000 (+30.10%)
Projected 2013: $2,569,950,000 (+1.90%) Estimated 2013: $10,202,708,000 (+1.90%)
Projected 2012: $2,521,958,000 (+16.20%) Estimated 2012: $10,012,180,000 (+16.20%)
Projected 2011: $2,170,370,000 Estimated 2011: $ 8,616,900,000
Projected 2015-17: $2,988,100,000 (-16.9%) Estimated 2015-17: $13,844,682,000 (-16.9%)
Projected 2014-16: $3,599,200,000 (+1.30%) Estimated 2014-16: $16,676,076,000 (+1.30%)
Projected 2013-15: $3,552,850,000 (+40.88%) Estimated 2013-15: $16,461,324,000 (+40.88%)
Projected 2012-14: $2,943,304,000 (+21.40%) Estimated 2012-14: $11,684,920,000 (+21.40%)
Projected 2011-13: $2,424,338,000 Estimated 2011-13: $9,624,660,000
To accommodate uctuating sample sizes, for the past ve Whereas in 2013 we saw a large increase in 3-year
years we have reported investment gures normalized to 100 investment budgets and a tiny one in 1-year budgets and an
companies as a primary year-on-year comparison. is gure opposite result in 2014, this year we see a modest decline
is calculated as the product of the mean of each category in 1-year investment budgets and a more substantive one
range and the percentage of total participants indicating that in 3-year budgets, suggesting increased uncertainty in the
category, except in the case of the largest ($250 million or medium term.
more) category, for which the minimum value is used.
286