
Page 47 - 2025 Special Report
P. 47
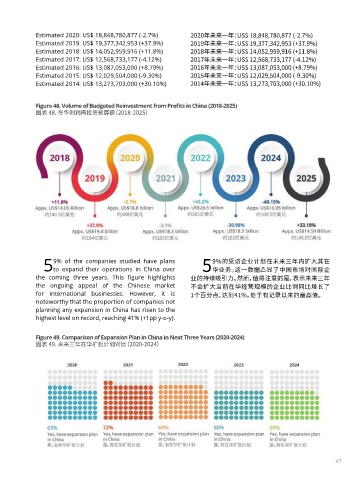
Estimated 2020: US$ 18,848,780,877 (-2.7%)         2020年未来一年:US$ 18,848,780,877 (-2.7%)
             Estimated 2019: US$ 19,377,342,953 (+37.9%)        2019年未来一年:US$ 19,377,342,953 (+37.9%)
             Estimated 2018: US$ 14,052,959,916 (+11.8%)        2018年未来一年:US$ 14,052,959,916 (+11.8%)
             Estimated 2017: US$ 12,568,733,177 (-4.12%)        2017年未来一年:US$ 12,568,733,177 (-4.12%)
             Estimated 2016: US$ 13,087,053,000 (+8.79%)        2016年未来一年:US$ 13,087,053,000 (+8.79%)
             Estimated 2015: US$ 12,029,504,000 (-9.30%)        2015年未来一年:US$ 12,029,504,000 (-9.30%)
             Estimated 2014: US$ 13,273,703,000 (+30.10%)       2014年未来一年:US$ 13,273,703,000 (+30.10%)


             Figure 48. Volume of Budgeted Reinvestment from Profits in China (2018-2025)
             图表 48. 在华利润再投资预算额(2018-2025)


                   9% of the companies studied have plans              9%的受访企业计划在未来三年内扩大其在
               5to  expand  their  operations  in  China  over      5华业务。这一数据凸显了中国市场对国际企
             the  coming  three  years.  This  figure  highlights   业的持续吸引力。然而,值得注意的是,表示未来三年
             the ongoing  appeal of the Chinese  market         不会扩大当前在华经营规模的企业比例同比增长了
             for international  businesses. However, it is      1个百分点,达到41%,处于有记录以来的最高值。
             noteworthy that the proportion of companies not
             planning any expansion in China has risen to the
             highest level on record, reaching 41% (+1pp y-o-y).


             Figure 49. Comparison of Expansion Plan in China in Next Three Years (2020-2024)
             图表 49. 未来三年在华扩张计划对比(2020-2024)


 46                                                                                                             47