Page 474 - 2018 White Paper on the Business Environment in China
P. 474
2001188WWhhiteitPeaPpaepr oenr othne tBhuesinBeussiEnnevsirsoEnnmveinrot ninmCehnintain China
4.1
Study
Demographics
From September to December 2017, AmCham
South China conducted its annual study of com-
panies with established operations in China through
simple random sampling. Though 244 companies
participated in the study in total, we finally adopted
reliable and valid responses from 215 companies to
ensure a high degree of data integrity.
In general, the demographics of participating com-
panies are similar to previous years, and the findings
of the study depict a general picture of the economic
development of companies in South China. The survey
respondents come from all walks of life, representing a
broad range of companies by industry, most of which
are either headquartered or have located their main
offices in South China. We see companies of all sizes,
from those with fewer than 250 employees to those
with more than a thousand. We also have companies of
different legal entities including wholly U.S. or Eu-
rope-owned companies, other foreign-owned compa-
nies or joint ventures funded by other countries and
regions, as well as Mainland Chinese companies.
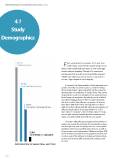
To better reflect the present general economic sit-
uation, we classify the industry of participating compa-
nies into primary and secondary sectors, consumption
products and services, professional services, as well as
other services and organizations. While more than 40%
of the survey respondents are engaged in professional
services, more than 30% are in primary and secondary
sectors, and around 20% consumption products and
services.
Distribution of Industrial Sectors
474
4.1
Study
Demographics
From September to December 2017, AmCham
South China conducted its annual study of com-
panies with established operations in China through
simple random sampling. Though 244 companies
participated in the study in total, we finally adopted
reliable and valid responses from 215 companies to
ensure a high degree of data integrity.
In general, the demographics of participating com-
panies are similar to previous years, and the findings
of the study depict a general picture of the economic
development of companies in South China. The survey
respondents come from all walks of life, representing a
broad range of companies by industry, most of which
are either headquartered or have located their main
offices in South China. We see companies of all sizes,
from those with fewer than 250 employees to those
with more than a thousand. We also have companies of
different legal entities including wholly U.S. or Eu-
rope-owned companies, other foreign-owned compa-
nies or joint ventures funded by other countries and
regions, as well as Mainland Chinese companies.
To better reflect the present general economic sit-
uation, we classify the industry of participating compa-
nies into primary and secondary sectors, consumption
products and services, professional services, as well as
other services and organizations. While more than 40%
of the survey respondents are engaged in professional
services, more than 30% are in primary and secondary
sectors, and around 20% consumption products and
services.
Distribution of Industrial Sectors
474