Page 272 - 2015_WhitePaper_web
P. 272
5 White Paper on the Business Environment in China
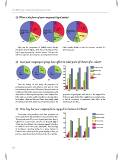
Q: What is the form of your company?? legal entity?
Other Other Other
(5%) (6%) (6%)
Local Chinese Local Chinese Wholly-Owned Local Chinese
Company Company Foreign Enterprise Company
(27%) (25%) (45%) (21%)
Wholly-Owned Wholly-Owned Joint
Foreign Enterprise Foreign Enterprise Venture
(46%) (50%) (14%)
Joint 2014 Representative Joint Venture
Office (10%)
Venture (5%)
Repre-
Represen- (13%) sentative
Office
tativeOffice (18%)
2015 (9%) 2013
is year the proportion of Wholly-owned Foreign O ces nearly double to reach 8.6 percent, up from 4.5
Enterprises shrank slightly, while that of Mainland China- percent last year.
based companies grew by a similar amount. is year also
saw the proportion of participants operating Representation
Q: Does your company or group have o ces in other parts of China? If so, where?
No No No 80% Yangtze River Delta
(32%) (29%) (27%) 70% Northern China
60% Western China
Yes Yes Yes 50% Other
(68%) (71%) (73%) 40%
30%
2015 2014 2013 20%
10%
Over the history of this study, the proportion of 2014 2013
participating companies with o ces in other parts of China 0%
has consistently been around 70 percent; this year?? results are 2015
no di erent. Also similar to prior years, most participants with
other o ces in China reported a presence in the Yangtze River proportion of participants with o ces in the Yangtze River
Delta with successively smaller population reporting o ces Delta once again declined by roughly four percentage points,
in Northern China and Western China. Interestingly, while as did the proportion of participants with o ces in the
the ranking of the three regions has remained consistent, the northern part of China.
Q: How long has your company been engaged in business in China?
Continuing a long-standing trend, older companies are 50% More than 20 years
more represented in this study than in any previous iteration. 40% From 10 to 20 years
30% From 6 to 9 years
is year just under 84 percent of participants have been in 20% From 2 to 5 years
China for 6 or more years; moreover, an historical high of 10% Less than 2 years
34 percent of participants report having engaged in business
in China for 20 or more years. Meanwhile, the percentage
of participants reporting having been doing business in
China for two or fewer years has grown slightly, reaching 5.8
percent??own from last year?? historical low of 3.6 percent.
0% 2014 2013
2015
272