
Page 114 - 2025 Special Report
P. 114
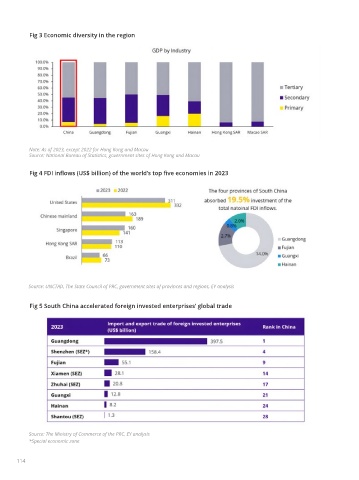
Fig 3 Economic diversity in the region


           Note: As of 2023, except 2022 for Hong Kong and Macau
           Source: National Bureau of Statistics, government sites of Hong Kong and Macau


           Fig 4 FDI inflows (US$ billion) of the world’s top five economies in 2023


          Source: UNCTAD, The State Council of PRC, government sites of provinces and regions, EY analysis


           Fig 5 South China accelerated foreign invested enterprises’ global trade


           Source: The Ministry of Commerce of the PRC, EY analysis
           *Special economic zone


       114                                                                                                                                                                                                                            115