Page 468 - 2022 White Paper on the Business Environment in China
P. 468
2 White Paper on the Business Environment in China
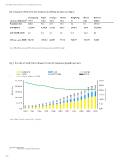
Fig 1 Snapshot of key economic indicators in 2020 by province and region
Guangdong Fujian Guangxi Hainan Hong Kong Macao National
124.0 237.6 35.4 1.1 0.03 9,600.0
Land area (??000 km2)5 179.7 41.5 50.1 10.1 6.5 0.7 1,411.8
2,410.4 157.9 101,598.6
Population (m) 126.0 4,390.4 2,215.7 553.2
-6.1 -56.3 2.3
GDP (RMB b) 11,076.1
GDP growth rate% 2.3 3.3 3.7 3.5
GDP per capita (RMB) 88,210 105,818 44,309 55,131 298,255 228,251 72,000
Source: Wind, The state council of PRC, Government site of provinces, region, and SARs, EY analysis
Fig 2 The GDP of South China showed a trend of continuous growth over time
Source: Wind, The state council of PRC, EY analysis
5 ??000 km2: square kilometer
468