Page 516 - 2021 White Paper
P. 516
1 White Paper on the Business Environment in China
rising demand for an improved quality of life will
also support development of modern services
across the region. This could thereby create a
more developed and interconnected South China
with the Pearl River Delta at its center.
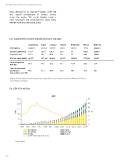
Fig 1 Snapshot of key economic indicators by province and region
Guangdong Fujian Guangxi Hainan Hong Kong Macao National
530.9 2,527.4 371.9 99,086.5
GDP (RMB b) 10,767.1 4,239.5 2,123.7 33.9 1.1 0.031 9,600.0
121.4 236.7 9.5 7.5 0.68 1,400.1
Land area (??000 km2) 177.9 39.7 49.6 56,507 336,655 552,285 70,892
Population (m) 115.2 6.5 157.8 24.2 17.4
GDP per capita (RMB) 94,172 107,139 42,964 73.3
Share of export to 40.3 19.5 12.2
GDP (%)
Share of household
spending to 74.3 71.1 70.4 74.3 73.7 70.1
disposable income (%)
Note: As of 2019 except for household spending to disposable income in Hong Kong (2016) and Macau (2012/2013)
Source: Wind, EY estimates
Fig 2 GDP of South China
Source: Wind
516
rising demand for an improved quality of life will
also support development of modern services
across the region. This could thereby create a
more developed and interconnected South China
with the Pearl River Delta at its center.
Fig 1 Snapshot of key economic indicators by province and region
Guangdong Fujian Guangxi Hainan Hong Kong Macao National
530.9 2,527.4 371.9 99,086.5
GDP (RMB b) 10,767.1 4,239.5 2,123.7 33.9 1.1 0.031 9,600.0
121.4 236.7 9.5 7.5 0.68 1,400.1
Land area (??000 km2) 177.9 39.7 49.6 56,507 336,655 552,285 70,892
Population (m) 115.2 6.5 157.8 24.2 17.4
GDP per capita (RMB) 94,172 107,139 42,964 73.3
Share of export to 40.3 19.5 12.2
GDP (%)
Share of household
spending to 74.3 71.1 70.4 74.3 73.7 70.1
disposable income (%)
Note: As of 2019 except for household spending to disposable income in Hong Kong (2016) and Macau (2012/2013)
Source: Wind, EY estimates
Fig 2 GDP of South China
Source: Wind
516