Page 416 - 2020 White Paper on the Business Environment in China
P. 416
0 White Paper on the Business Environment in China
Economic Overview in South China
aOndvehrovsipeiwtality, it is also creating a supply chain
oSf oiudtehaC, hreinsaouisrcaesleaanddingtaelenngtisneinin Citshinviac??snietyconomic growth that includes not only the
rpegroiovnin. ceMoeaf nGwuhailneg, droenggio,nFaul jiacno,nnGeucatinvigtyxi, aanndd Hainan, but also the Special Administrative
rRisienggiodnesmoafnHdofnogr Kimonpgroavendd Mquaacliatyu.oTfolgifeethweirll, the economy of these regions measured at
aRlsMo Bs1u8p.p5o8rtt inde2v0e1lo8p,moer natrooufndmo2d0e.6rn% soefrtvhiceesnational GDP. Much of the economy is
accoronscsetnhterarteegdioant. tIht ecocuoldastthaelrreebgyiocnreeatsepaecmiaollrye the Pearl River Delta.
developed and interconnected South China with
tFhiegP1eaSrnl aRpivsehrotDoeflktaeyaet citosncoemnitceirn.dicators by province and region
Guangdong FujianGuangxiHainan Hong MacauNational
Fig 1 Snapshot of key economic indicators by province and region Kong
GDP (RMB b) Guangdong Fuji9an,727G.7ua3n,g5x8i0.4 H2ai,n0a3n5.3 H4o8n3g.K2ong2,395M.8acao361.5N9at0io,n0a3l1.0
GLDaPn(dRMaBreb)a (??000 km9,722)7.7 3,580.41772.,9035.1321.4 483.2236.7 2,33935..89 23.681.5 0.03190,093,15.097.0
Land area (??000 km2) 177.9 121.4 236.7 33.9 2.8 0.031 9,597.0
PPoopupluatliaontio(mn) (m) 113.5 39.4 1134.95.3 39.4 9.3 49.3 7.5 9.3 70..567 0.671,3915,.3495.4
GGDDP Pperpcearpictaa(pRMitaB)(R8M6,4B12) 91,19876,41412,49891,197 514,9155,489 5312,19,55450 321,5454075,54427,54264,66444,644
Share of export to to43G.9DP 21.3 431.09.7 21.3 6.2 10.7 173.66.2 1732.46.9 24.918.2 18.2
GSDhPa(%re) of export
S(h%ar)e of household 72.8 73.7 71.8
spending to 70.4 69.5 71.3 74.3
dSishpaosraebloefinhcomusee(%h)old 74.3 73.7 71.8
72.8 70.4 69.5 71.3
spending to disposable
Ninotce:oAms oef 20(1%8 e)xcept household spending to disposable income in Hong Kong (2016) and Macao (2012/2013)
Source: Wind
Note: As of 2018 except household spending to disposable income in Hong Kong (2016) and Macau (2012/2013)
Source: Wind
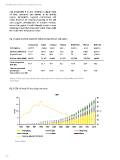
Fig 2 GDP of South China rising over time
Fig 2 GDP of South China rising over time
GDP 45
20
40
15
35
RMB t
%
10 30
25
5
20
0 15
1985 1988 1991 1994 1997 2000 2003 2006 2009 2012 2015 2018
Guangdong Fujian Hong Kong
Guangxi Hainan Macau
Share of national GDP (RHS)
Source: Wind
Source: Wind
416
Economic Overview in South China
aOndvehrovsipeiwtality, it is also creating a supply chain
oSf oiudtehaC, hreinsaouisrcaesleaanddingtaelenngtisneinin Citshinviac??snietyconomic growth that includes not only the
rpegroiovnin. ceMoeaf nGwuhailneg, droenggio,nFaul jiacno,nnGeucatinvigtyxi, aanndd Hainan, but also the Special Administrative
rRisienggiodnesmoafnHdofnogr Kimonpgroavendd Mquaacliatyu.oTfolgifeethweirll, the economy of these regions measured at
aRlsMo Bs1u8p.p5o8rtt inde2v0e1lo8p,moer natrooufndmo2d0e.6rn% soefrtvhiceesnational GDP. Much of the economy is
accoronscsetnhterarteegdioant. tIht ecocuoldastthaelrreebgyiocnreeatsepaecmiaollrye the Pearl River Delta.
developed and interconnected South China with
tFhiegP1eaSrnl aRpivsehrotDoeflktaeyaet citosncoemnitceirn.dicators by province and region
Guangdong FujianGuangxiHainan Hong MacauNational
Fig 1 Snapshot of key economic indicators by province and region Kong
GDP (RMB b) Guangdong Fuji9an,727G.7ua3n,g5x8i0.4 H2ai,n0a3n5.3 H4o8n3g.K2ong2,395M.8acao361.5N9at0io,n0a3l1.0
GLDaPn(dRMaBreb)a (??000 km9,722)7.7 3,580.41772.,9035.1321.4 483.2236.7 2,33935..89 23.681.5 0.03190,093,15.097.0
Land area (??000 km2) 177.9 121.4 236.7 33.9 2.8 0.031 9,597.0
PPoopupluatliaontio(mn) (m) 113.5 39.4 1134.95.3 39.4 9.3 49.3 7.5 9.3 70..567 0.671,3915,.3495.4
GGDDP Pperpcearpictaa(pRMitaB)(R8M6,4B12) 91,19876,41412,49891,197 514,9155,489 5312,19,55450 321,5454075,54427,54264,66444,644
Share of export to to43G.9DP 21.3 431.09.7 21.3 6.2 10.7 173.66.2 1732.46.9 24.918.2 18.2
GSDhPa(%re) of export
S(h%ar)e of household 72.8 73.7 71.8
spending to 70.4 69.5 71.3 74.3
dSishpaosraebloefinhcomusee(%h)old 74.3 73.7 71.8
72.8 70.4 69.5 71.3
spending to disposable
Ninotce:oAms oef 20(1%8 e)xcept household spending to disposable income in Hong Kong (2016) and Macao (2012/2013)
Source: Wind
Note: As of 2018 except household spending to disposable income in Hong Kong (2016) and Macau (2012/2013)
Source: Wind
Fig 2 GDP of South China rising over time
Fig 2 GDP of South China rising over time
GDP 45
20
40
15
35
RMB t
%
10 30
25
5
20
0 15
1985 1988 1991 1994 1997 2000 2003 2006 2009 2012 2015 2018
Guangdong Fujian Hong Kong
Guangxi Hainan Macau
Share of national GDP (RHS)
Source: Wind
Source: Wind
416