Page 60 - 2019 Special Report on the State of Business in South China
P. 60
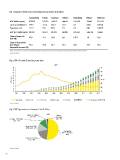
1 Snapshot of key economic indicators by province and region
GDP (billion yuan) Guangdong Fujian Guangxi Hainan Hong Kong Macao National
82,712.2
Land area (??000 km2) 8,970.5 3,218.2 1,852.3 446.25 2,291.07 334.47 9,597.0
Population (m) 177.9 121.4 236.7 33.9 2.8 0.031 1,403.5
111.7 39.1 48.9 9.3 7.4 0.62 59,660
GDP per capita (yuan) 80,932 82,677 38,102 48,430 325,526 546,734 18.5
Share of export to 47.0 22.1 10.0 6.6 145.7 2.8 71.8
GDP (%)
Share of household 73.0 67.2 69.1 74.3
spending to 77.4 73.7
disposable income (%)
Note: As of 2017 except household spending to disposable income in Hong Kong (2016) and Macao (2012/2013)
Source: Wind
Fig 2 GDP of South China rising over time
Macao
Source: Wind
Fig 3 GDP by province and region in South China
Source: Wind
60